
Team reporting guide
Show the problem. Send it to the right team.
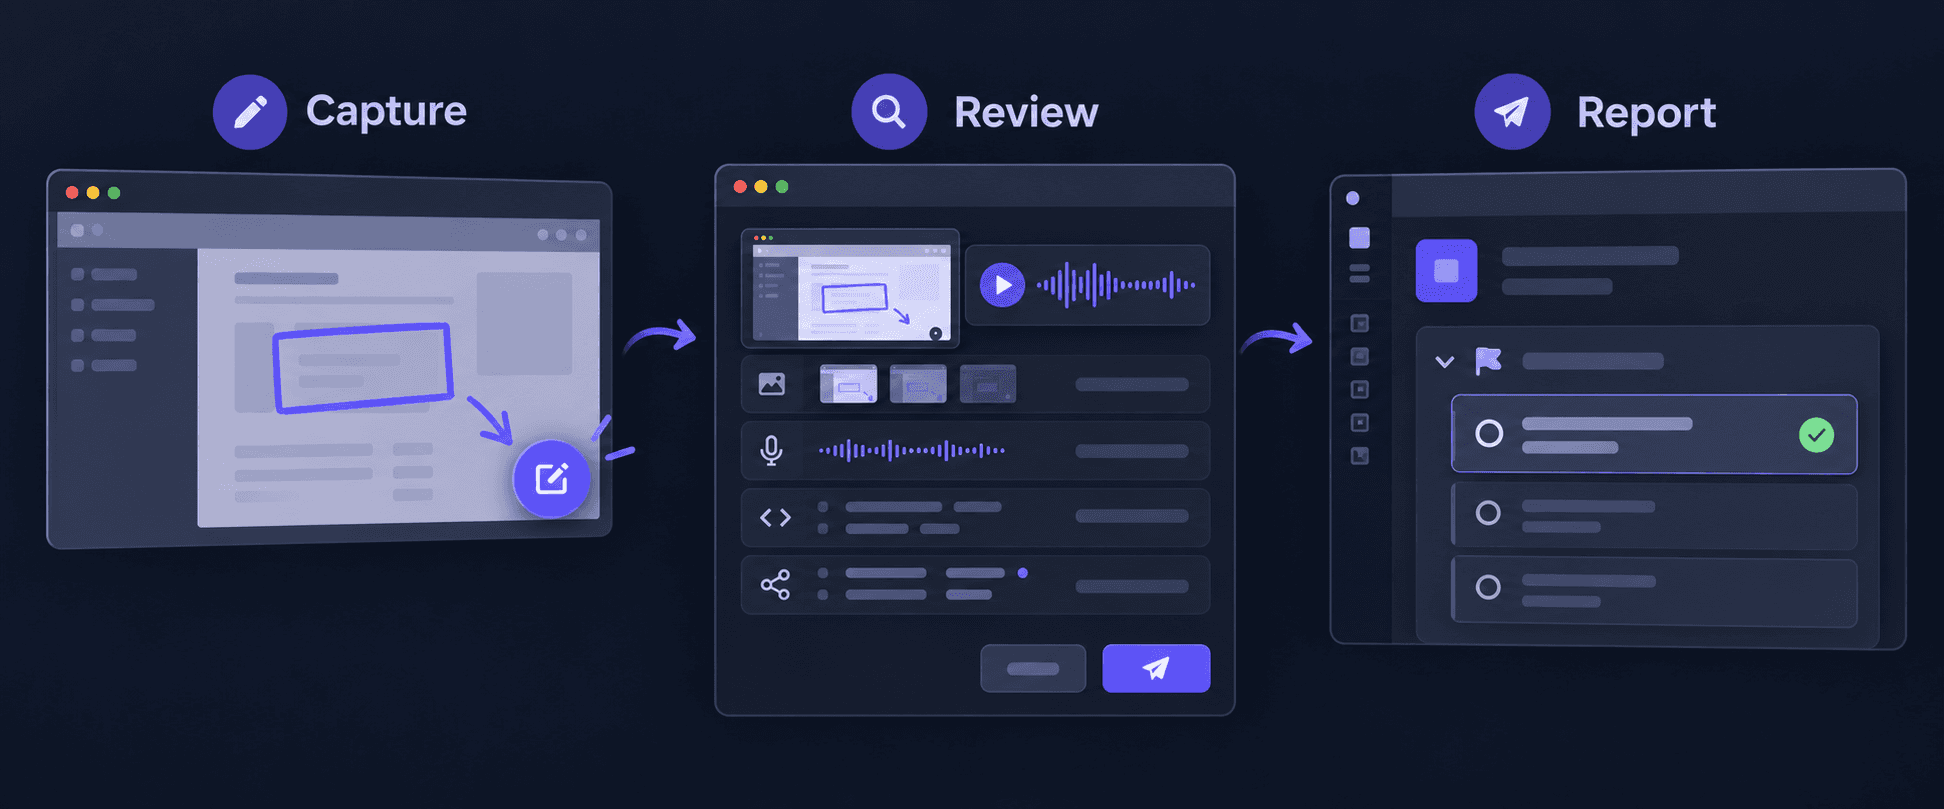
Put a reporting helper inside your app, or open it with the Chrome extension. Your team receives a private report with reviewed screenshots, recorded steps and diagnostics. A project decides where that report becomes a Jira or GitHub ticket.
Set up your team
Use your Personal workspace for private work. For a shared app, create an organisation first so the project, provider connection and reports belong to your team.
- Sign in and open Organisations. Choose Create organisation, name the team, then select it in the workspace switcher.
- Open the organisation's Members tab and choose Invite a teammate. Enter one colleague's email, choose their role, select Email invitation and click Send invitation. Repeat for each person.
- The colleague opens the email link, signs in with the matching verified email, reviews the workspace and role, then chooses Accept invitation. They can now select the organisation in tautau.
Members contribute and work with reports. Viewers can read the shared workspace. Owners and admins configure projects, services and provider connections; only an owner can invite another admin. The role description in the invitation form shows what you are granting.
A new Teams workspace has a 14-day evaluation with five seats. The organisation's plan view shows its end date and allowance. After evaluation, existing content remains readable while new captures and edits pause until the plan is renewed. Personal billing stays separate.
Connect Jira and choose an epic
The Jira connection grants access to a site. The project stores the destination for its apps. You can reuse one connection across several projects, each with a different epic.
- Select your team workspace, open Projects and add a project. Add the app under Services, then select it under Apps in this project.
- Under Ticket destination, choose Connect GitHub or Jira. In Integrations, choose Connect Jira.
- At Atlassian, use an account that has access to the intended Jira site and permission to create issues. Review the requested access, select that site and complete consent. Return to the project after tautau confirms the connection.
- Select the Ticket connection, Jira site, Jira project and a standard issue type such as Bug. Find the epic by name or exact key, select it, then choose Save project setup.
Each service belongs to one project. Moving it changes where future tickets go; its existing reports and keys stay with the service. A project with incomplete ticket settings can still receive reports, but ticket creation waits for a valid destination. To use GitHub, select a connected account and repository in the same project setup.
Keep the provider connection in the same workspace as the project. If access is revoked or the Jira account changes, reconnect through Integrations and check the project destination again. Your colleagues can use the configured workspace connection without receiving its OAuth credentials.
Install the helper in your app
- In Services, add the app's name and its production origin, for example
https://app.example.com. An origin is the scheme, hostname and optional port, without a path. Save the service. - Open its Installation tab and choose the environment. Use a separate environment and key for development, such as
http://localhost:3000. Allowed origins must match exactly; another subdomain or port needs its own entry. - Copy the generated installation snippet while the full key is displayed. Paste it into the app, deploy that app, then open an allowed page. The default launcher opens Report a bug.
- Return to the service and check its connection status. SDK connected confirms a visit reached tautau. It does not create a report or a Jira ticket.
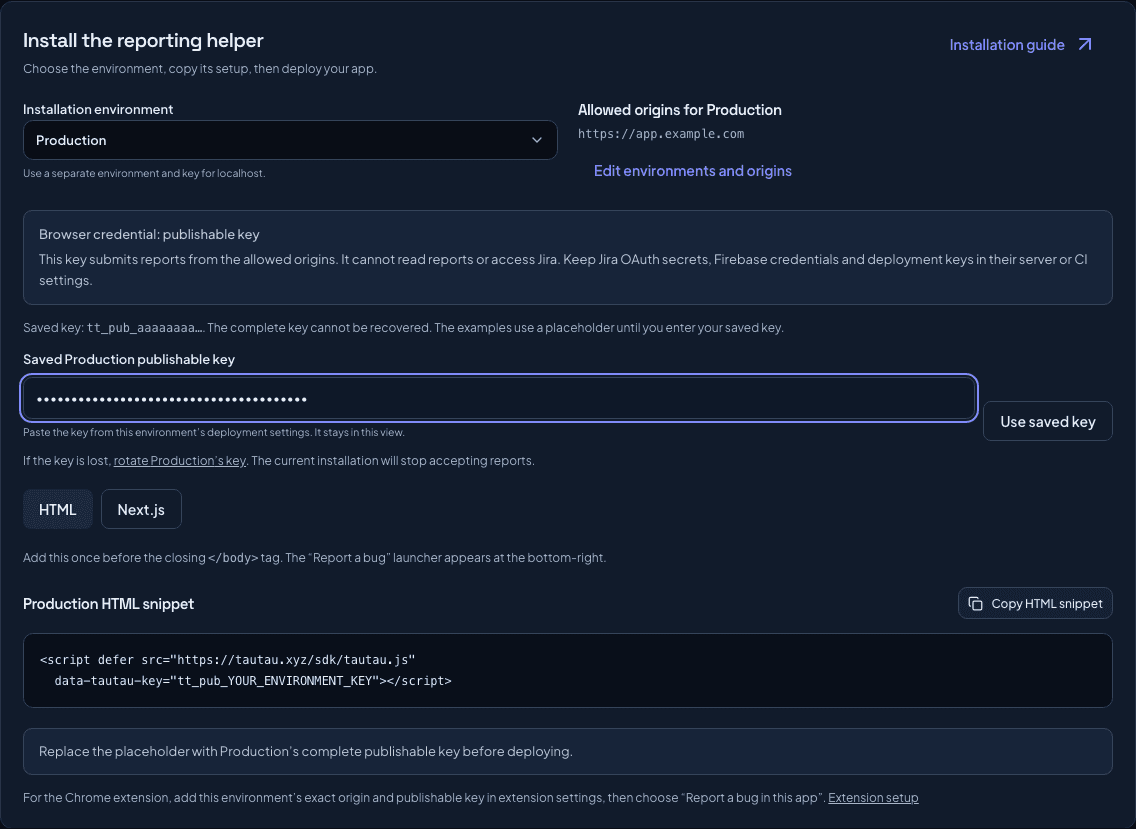
On return visits, Installation shows the key's prefix. Enter your saved publishable key from the app's deployment settings and choose Use saved key to fill the snippets.
HTML · before the closing body tag
<script defer src="https://tautau.xyz/sdk/tautau.js"
  data-tautau-key="tt_pub_YOUR_PRODUCTION_KEY"></script>
For Next.js App Router, use a server component to read runtime configuration and a client component to own the reporter. Add it once to a persistent layout, such as your signed-in app layout. The server passes only the publishable key and allowed origins to the browser.
Next.js · hosting environment
TAUTAU_ENABLED=1
TAUTAU_PUBLISHABLE_KEY=tt_pub_YOUR_ENVIRONMENT_KEY
TAUTAU_ALLOWED_ORIGINS=https://app.example.com
Next.js · server component
// components/TautauEmbed.jsx (server component)
import { connection } from 'next/server';
import TautauReporter from './TautauReporter';

export default async function TautauEmbed() {
  await connection();
  if (process.env.TAUTAU_ENABLED !== '1') return null;
  return <TautauReporter
    ingestKey={process.env.TAUTAU_PUBLISHABLE_KEY || ''}
    origins={(process.env.TAUTAU_ALLOWED_ORIGINS || '')
      .split(',').map(origin => origin.trim()).filter(Boolean)}
  />;
}
Next.js · client component
// components/TautauReporter.jsx
'use client';
import Script from 'next/script';
import { useEffect, useState, useSyncExternalStore } from 'react';

const subscribe = () => () => {};
const browserOrigin = () => window.location.origin;
const serverOrigin = () => '';

export default function TautauReporter({ ingestKey, origins }) {
  const [ready, setReady] = useState(false);
  const origin = useSyncExternalStore(subscribe, browserOrigin, serverOrigin);
  const originSignature = origins.join(',');
  const allowed = !!origin && origins.includes(origin)
    && /^tt_pub_[a-f0-9]{32}$/.test(ingestKey);

  useEffect(() => {
    if (!allowed || !ready || !window.Tautau) return;
    const reporter = window.Tautau.createTautau({
      ingestKey,
      persistDrafts: false,
      capture: { mode: 'reports-only',
        blockSelectors: ['[data-tautau-private]'] },
    });
    return () => reporter.destroy();
  }, [allowed, ready, ingestKey, originSignature]);

  if (!allowed) return null;
  return <Script src="https://tautau.xyz/sdk/tautau.js"
    strategy="afterInteractive" onReady={() => setReady(true)} />;
}
Next.js · layout placement
// In your signed-in app layout
import TautauEmbed from '@/components/TautauEmbed';

// Add <TautauEmbed /> alongside the app’s content.
// Keep the component outside public login pages if reporting is for members only.
The client checks the current origin before loading the helper. Its effect creates the reporter when the SDK is ready, then calls destroy() on cleanup. This handles React Strict Mode, unmounts and configuration changes without leaving capture hooks active. Reports-only mode waits for the helper to open before collecting events; loading it never starts screen or microphone recording.
The Next.js and custom button examples here use persistDrafts: false, so unfinished reports are not kept in browser storage. Use the default or set it to true if your app needs draft recovery on the same device.
To use your own button or control the reporter's lifetime, use the hosted module. Call destroy() when the owning app is torn down.
Browser module · custom launcher
import { createTautau } from 'https://tautau.xyz/sdk/tautau.mjs';

const reporter = createTautau({
  ingestKey: 'tt_pub_YOUR_ENVIRONMENT_KEY',
  launcher: false,
  persistDrafts: false,
  capture: {
    mode: 'reports-only',
    blockSelectors: ['[data-tautau-private]'],
  },
});
document.querySelector('#report-bug')
  .addEventListener('click', () => reporter.openReport());

// On application teardown:
// reporter.destroy();
The hosted script and module are available directly. Don't assume the @tautau/browser package is published to npm. For configuration, lifecycle and content security policy details, read the browser SDK reference.
Inject the right credentials
Only the environment's tt_pub_ key belongs in the frontend. It is publishable and admits reports from the configured origins. It cannot read private reports, access Jira, inspect a repository or start fixes.
The Next.js example above reads TAUTAU_ENABLED, TAUTAU_PUBLISHABLE_KEY and TAUTAU_ALLOWED_ORIGINS on the server at request time. Its await connection() makes that runtime read explicit. Set them in your hosting platform or container environment, then restart or redeploy so the process receives the new values.
If your app instead uses a NEXT_PUBLIC_ variable in client code, Next.js embeds it at build time. Changing that value requires a rebuild and redeploy. A key read on the server is still publishable once passed to the browser; the server component is a way to choose runtime configuration, not to hide the key.
| Credential | Where it belongs |
|---|---|
tt_pub_ environment key | App HTML, public build configuration or Chrome reporting settings. |
| Jira OAuth client secret and grant | tautau's server configuration and encrypted integration vault. Your app receives neither. |
tt_deploy_ deployment key | CI secrets, only when registering releases or source maps. |
| Resend key or private account/API tokens | Server or authorised local agent configuration. Never in the embed snippet. |
Register release context (optional)
Release context helps the team match a report to the code that was running. The helper works without it. To verify a release or resolve source maps, register the app's environment, version and full commit from CI.
- A workspace owner or admin opens the service's Repository tab, configures its repository and issues a deployment key.
- Save that
tt_deploy_key as a CI secret. Use the service's environment ID and the actual deployed version and commit in the release request. - Pass the same version and full commit to the SDK's
releaseoption, or the hosted script'sdata-releaseanddata-commitattributes. A report is verified only when its environment, version and commit match a registered release.
CI release registration · placeholders only
curl --fail --request POST https://tautau.xyz/api/capture/releases \
  --header "Authorization: Bearer $TAUTAU_DEPLOYMENT_KEY" \
  --header "Content-Type: application/json" \
  --data '{
    "environmentId": "env-YOUR_PRODUCTION_ENVIRONMENT",
    "version": "YOUR_DEPLOYED_VERSION",
    "commit": "FULL_40_CHARACTER_COMMIT_SHA",
    "url": "https://app.example.com"
}'Source maps can be included in that request, up to 20 files and 2 MB in total. The SDK reference has the payload format. Repository access and an installed runner are separate requirements for automated fix attempts.
Report through Chrome
The extension can open the same reporter without editing the app. It still needs the app's configured origin and publishable environment key.
- Follow the Chrome installation guide and open tautau's extension options.
- Under Report bugs in your app, enter the exact App origin and its Environment key. Choose Save report destination.
- Visit that origin, open the toolbar popup and choose Report a bug in this app. Review and send through the reporter.
This captures events after the reporter opens. It cannot recover earlier logs. The extension's separate screen recording, page scan and asset collection tools stay available, but their previous sessions are not automatically attached to this report. Send tautau feedback is for problems with tautau itself.
Capture and review a report
- Open the helper and describe What happened? Add what you expected. Use Dictate report if your browser supports speech recognition, then review the recognised words.
- Choose Screenshot and grant screen sharing. Select the current app tab where possible. Use Draw, Arrow, Box or Text to point out the problem. Draw is freehand: drag to make a stroke, or click once to add a dot. Drag with Box or Arrow to place a shape, then repeat to add more. Choose an annotation colour and Thin, Medium or Bold stroke width before drawing. Each mark keeps its own colour and width. Text labels can be typed or dictated; click the image to place them. Undo removes the most recent mark.
- Use Hide details to cover private areas. To reproduce a sequence, choose Record steps. Select Include my microphone when recording steps before recording if you want narration.
- Open Review diagnostics. Optionally enable Include page asset inventory (URLs only). Review every included image and clip, confirm the review checkbox, then choose Send report.
A recording is limited to 60 seconds and 50 MB. A report can include ten attachments, up to 100 MB in total. You can also upload an image or clip. Evidence and diagnostics use the workspace's storage and retention allowance.
Diagnostics include bounded console messages and error stacks, clicks, navigation, and request URL, method, status and timing. The helper does not read form values, request bodies, headers, cookies or browser storage. URLs lose query strings and fragments; common secrets and email addresses are redacted from diagnostic text. Review the preview for private text your app may have logged. An asset inventory lists page asset URLs without fetching their files. Attach the source image or clip separately if the team needs its bytes.
By default capture starts when the helper opens. To include events leading up to a problem, the app owner must enable breadcrumbs in the service's Capture policy and explicitly set capture.mode: 'breadcrumbs' in the SDK. The buffer is limited to 150 events.
If an evidence upload fails, retry the existing report instead of starting another. Text is saved first and upload retries keep the same report. By default the helper keeps a draft in this origin's browser storage for up to 24 hours; closing it preserves that draft. The app can disable this with persistDrafts: false.
Triage and create a ticket
- Select the team workspace and open Bug reports. Filter by app, open a report and review its screenshot, video, timeline, console, network and Assets views.
- Update the report's status, priority or assignment and add team notes as your role permits. If duplicate grouping is enabled, choose an occurrence to inspect the evidence from that attempt.
- Choose Create ticket. Review the body and exact project destination, including its Jira epic, before confirming. If the destination changed, refresh the preview and review it again.
Sending a report does not create an external ticket automatically. The confirmed export creates a ticket in the configured Jira project or GitHub repository and records its link. Retrying a completed export returns the existing ticket.
Share a private workspace link with a colleague who has access. An external evidence link, when allowed by workspace policy, grants access to anyone holding it until it expires or you revoke it. Team chat and fix controls remain private. Jira's issue permissions do not grant access to the private tautau evidence link.
Evidence chat can help inspect captured text, images and authorised source context, with citations. It cannot watch or hear a video. Fix the bug needs a separately configured repository and runner; it creates a draft pull request or reports a failure. It does not merge or deploy a fix.
Email and notifications
Open Notifications to read your private activity feed and choose emails for welcome/setup, new reports and report updates. These choices apply to your account. Turning off routine email keeps in-app notifications available and does not suppress invitations.
Report emails link you back to the signed-in workspace. Report descriptions, console messages, network diagnostics and attachments stay inside tautau. Recipients need current workspace membership and a verified account email.
For invitations, Email queued means sending is pending. Accepted by email provider means Resend accepted the message; it does not confirm that it reached an inbox. If email fails or sending is unavailable, a manager can share the invitation link or resend while it is active. The colleague still needs to accept it.
With an email/password account, follow the verification link, then refresh your email status in Get started or Account. Resend sends workspace mail; Firebase verifies the account address.
Set up reporting through MCP
The reporting tools in this section are available in the current tautau MCP source build. The published npm release does not yet include them. If your installed server does not list these tools, use the web setup above; updating from npm alone will not add reporting yet.
Use the reporting source build
This development option needs a tautau source checkout containing mcp/src/reporting-tools.ts. Run the build, then configure your MCP client to launch that checkout. Replace the example path with its absolute location and restart the client. If you do not have source access, use the web setup until the reporting package is published.
Build the source checkout
cd /absolute/path/to/tautau/mcp
npm ci
npm run build
Codex MCP configuration
[mcp_servers.tautau]
command = "node"
args = ["/absolute/path/to/tautau/mcp/src/index.js"]- Run
auth_loginand complete browser sign-in. Ask the agent to calllist_workspacesand select the intended team, thenlist_reporting_providersandlist_reporting_connections. - If needed, call
connect_reporting_providerfor Jira. In the opened browser, check you are signed into the same tautau account, choose Connect Jira and complete Atlassian consent. Verify the saved connection withlist_reporting_connections. - Use
discover_reporting_destinationsto resolve the Jira site, project, standard issue type and epic. Usecreate_reporting_projectorupdate_reporting_projectto save that destination. - Use
create_reporting_servicefor the app's production and development environments, assign its project and copy the returned publishable keys into the correct installation. Inspect the mapping withget_reporting_projectandget_reporting_service.
An example request to your agent
Set up reporting in our team workspace. Use the existing Jira
connection and route customer-portal bugs to project APP,
issue type Bug, under epic APP-42. Create separate production
and localhost environments. Show me the public installation
snippets. Do not create a test report or Jira ticket.
consent_pending means the browser grant still needs completion. not_configured means tautau's deployment needs provider setup; an agent's separate Atlassian connector is not a tautau integration.
MCP can submit a text report and bounded diagnostics, but it does not capture a screen or upload a recording. Use the browser helper for those. For tickets, first use preview_bug_report_ticket, review the destination and body, then explicitly authorise create_bug_report_ticket. If the preview cannot resolve an exact destination, configure the project destination above or review the report in the web app. Read the MCP installation guide for client setup.
Fix a setup problem
The helper does not appear
Confirm the app was rebuilt and deployed after adding the snippet or public environment variable. Check that the layout mounts it, the environment accepts reports, the key matches that environment and the page origin is allowed. The service’s connection status updates after a successful SDK visit.
The app blocks the script or uploads
Check the app’s content security policy. Allow tautau.xyz for the hosted script and reporting connections, the signed GCS upload origin for connections, and blob: for image and media previews. The SDK reference covers style nonces.
Jira cannot find the project or epic
Use an Atlassian account authorised for that Jira site, check its Create issues permission, and reconnect if necessary. Search the epic by exact key within the selected project. Choose a standard issue type rather than an epic or subtask.
A teammate cannot open the workspace
They must accept an active invitation with the matching verified email before they gain membership. Check the invitation’s role, expiry and workspace seat availability. A pending invitation or a Jira account alone does not grant tautau access.
Screen sharing or voice typing fails
Check Chrome and operating system screen recording or microphone permissions, then try again. Voice typing depends on the browser’s speech service; typed descriptions and annotations remain available.
Evidence or editing is unavailable
Check the service’s capture policy, evidence retention, workspace storage and plan end date. Expired evidence cannot be recovered through a share link. Keep or export important evidence before its retention period ends.
Return to Get started whenever you need the setup checklist, or open your service's installation view to check its environments and snippet.